

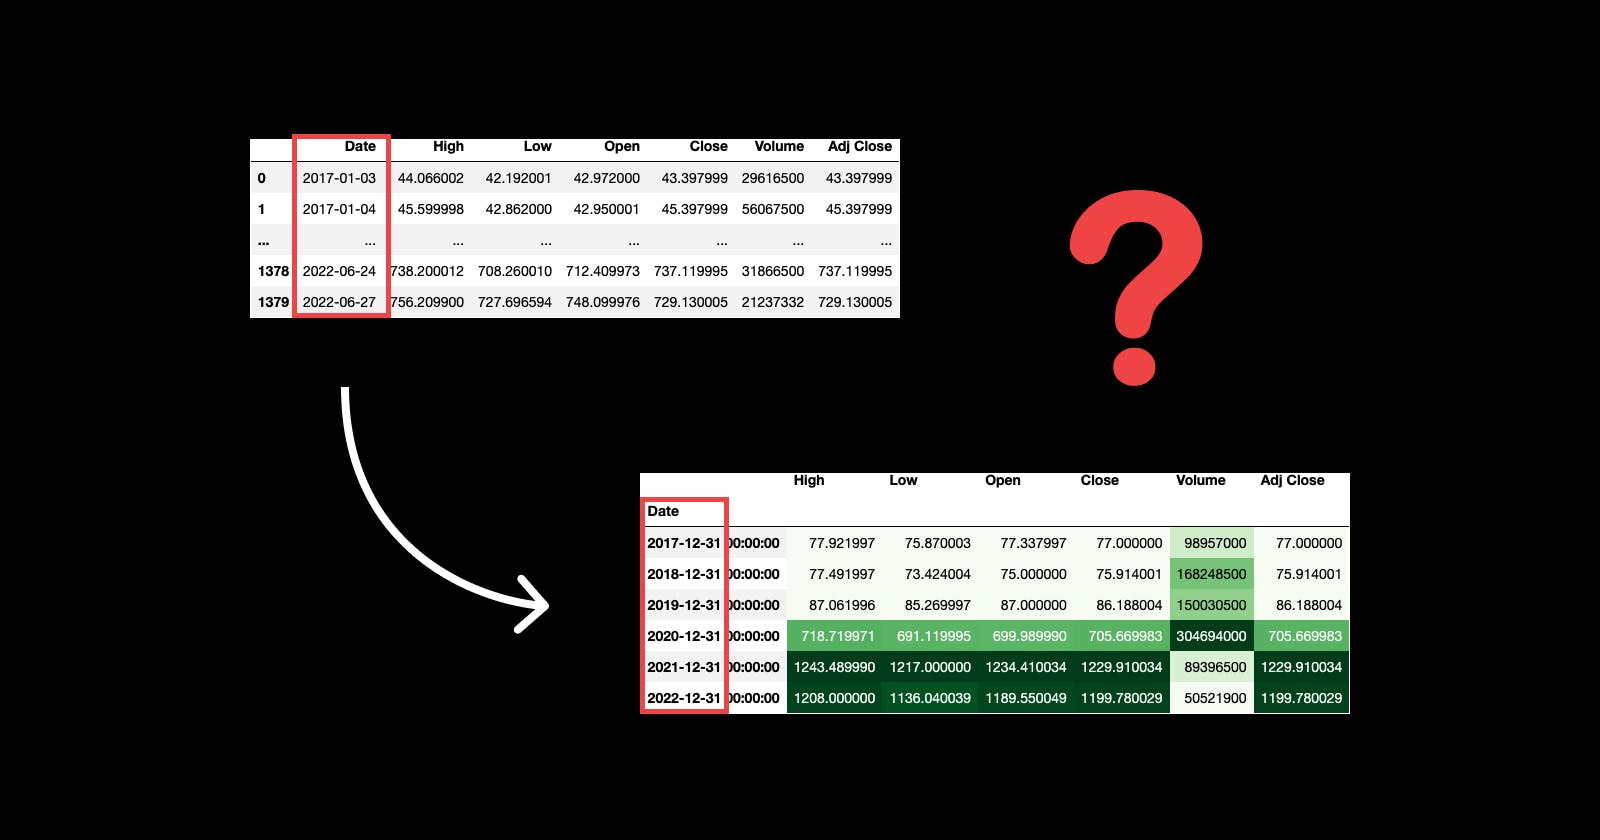


❌ Don't think of a for loop if you want to summarise your daily Time Series by years.
✅ Instead, use the function resample() from pandas.
Let me explain it with an example.
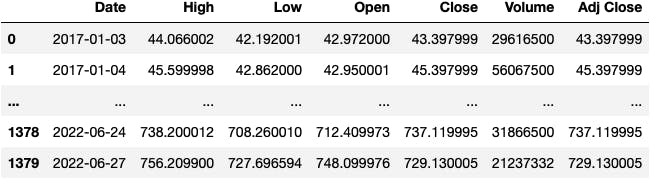
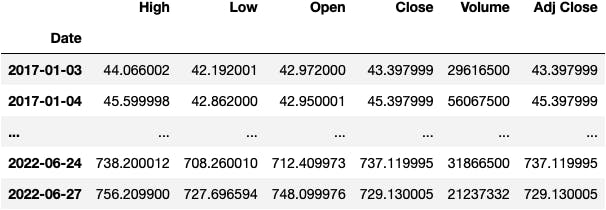
We start by loading a DataFrame from a CSV file that contains information on the TSLA stock from 2017-2022.
import pandas as pd

url = 'https://raw.githubusercontent.com/jsulopzs/data/main/tsla_stock.csv'

df_tsla = pd.read_csv(filepath_or_buffer=url)
df_tsla
cc: @elonmusk
You're welcome for the promotion 😉
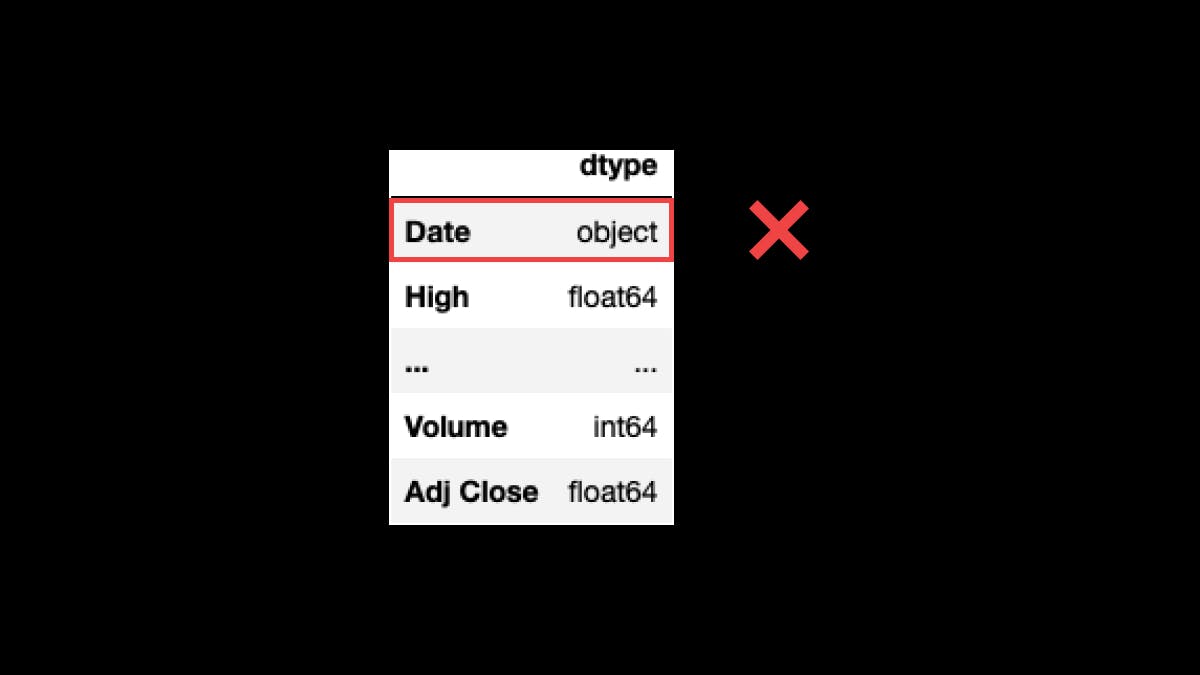
You must ensure that column Date's dtype is DateTime.
❌ It must not be an object as in the picture (often interpreted as a string).
df_tsla.dtypes.to_frame(name='dtype')
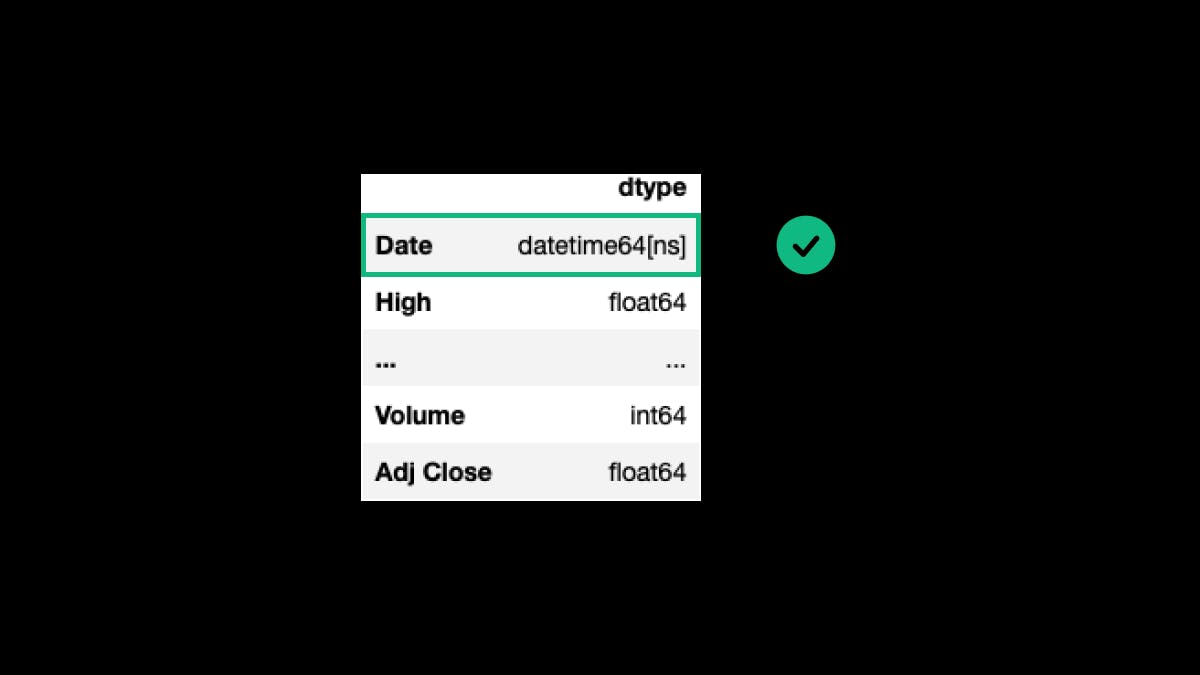
We need to convert the Date column into a datetime dtype. To do so, we can use the function pd.to_datetime():
df_tsla.Date = pd.to_datetime(df_tsla.Date)
df_tsla.dtypes.to_frame(name='dtype')
Before getting into the resample() function, we need to set the column Date as the index of the DataFrame:
df_tsla.set_index('Date', inplace=True)
df_tsla
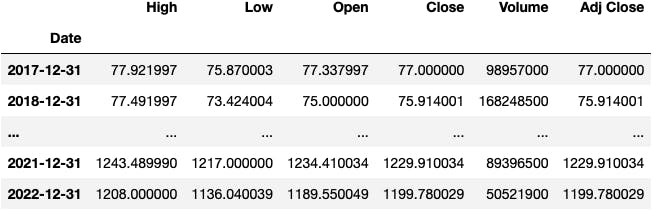
Now let the magic happen; we'll get the maximum value of each column by each year with this simple line of code:
df_tsla.resample(rule='Y').max()
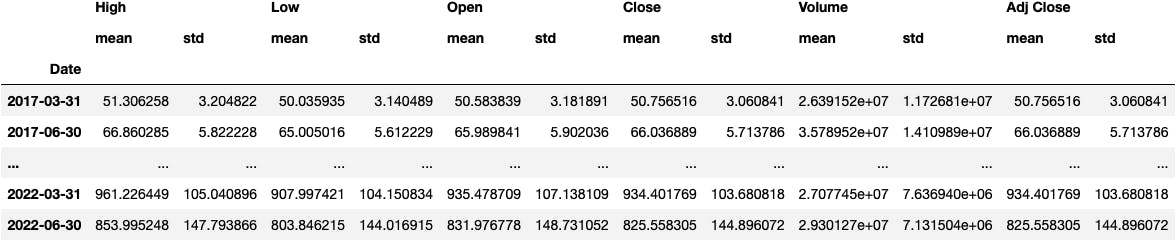
We can do many other things:
- Summarise by Quarter.
- Calculate the average and the standard deviation (volatility).
df_tsla.resample(rule='Q').agg(['mean', 'std'])
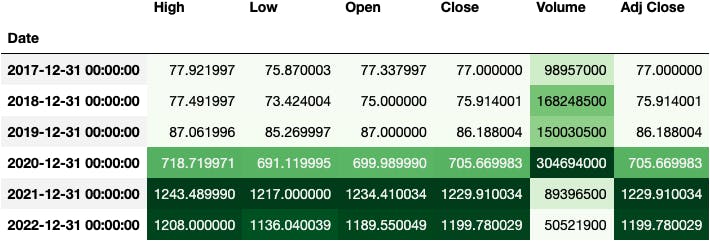
To finish it, I always like to add a background_gradient() to the DataFrame:
df_tsla.resample(rule='Y').max().style.background_gradient('Greens')
If you enjoyed this, I'd appreciate it if you could support my work by spreading the word 😊