

Summarise Time Series data with the DataFrame.resample function

J
I coach people to develop the Resolving Discipline that turns them into independent programmers.
Search for a command to run...
I coach people to develop the Resolving Discipline that turns them into independent programmers.
No comments yet. Be the first to comment.
This series of tutorials shows you how to work with Pandas, a Python library used to work with data tables.
A clear introduction to Pandas, a Python library to manipulate tabular data, where you can discover its many possibilities and get a concise overview.
Learn how to analyze Time Series data with ARIMA in Python.

Learn everything about filtering specific parts of the DataFrame based on conditions.

Read this story to learn the roadmap you could follow to get a python job where you can take your skills to the next level while you get paid.

Challenge Importance The time has come to add another layer to the hierarchy of Machine Learning models. Do we have the variable we want to predict in the dataset? YES: Supervised Learning Predicting a Numerical Variable → Regression Predicting a C...

❌ Don't think of a for loop if you want to summarise your daily Time Series by years.
✅ Instead, use the function resample() from pandas.
Let me explain it with an example.
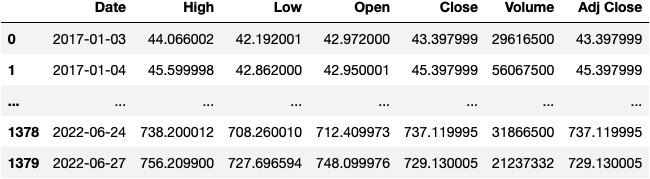
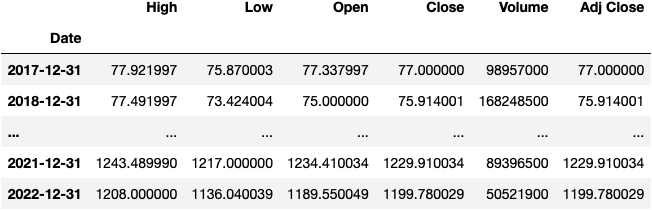
We start by loading a DataFrame from a CSV file that contains information on the TSLA stock from 2017-2022.
import pandas as pd

url = 'https://raw.githubusercontent.com/jsulopzs/data/main/tsla_stock.csv'

df_tsla = pd.read_csv(filepath_or_buffer=url)
df_tsla
cc: @elonmusk
You're welcome for the promotion 😉
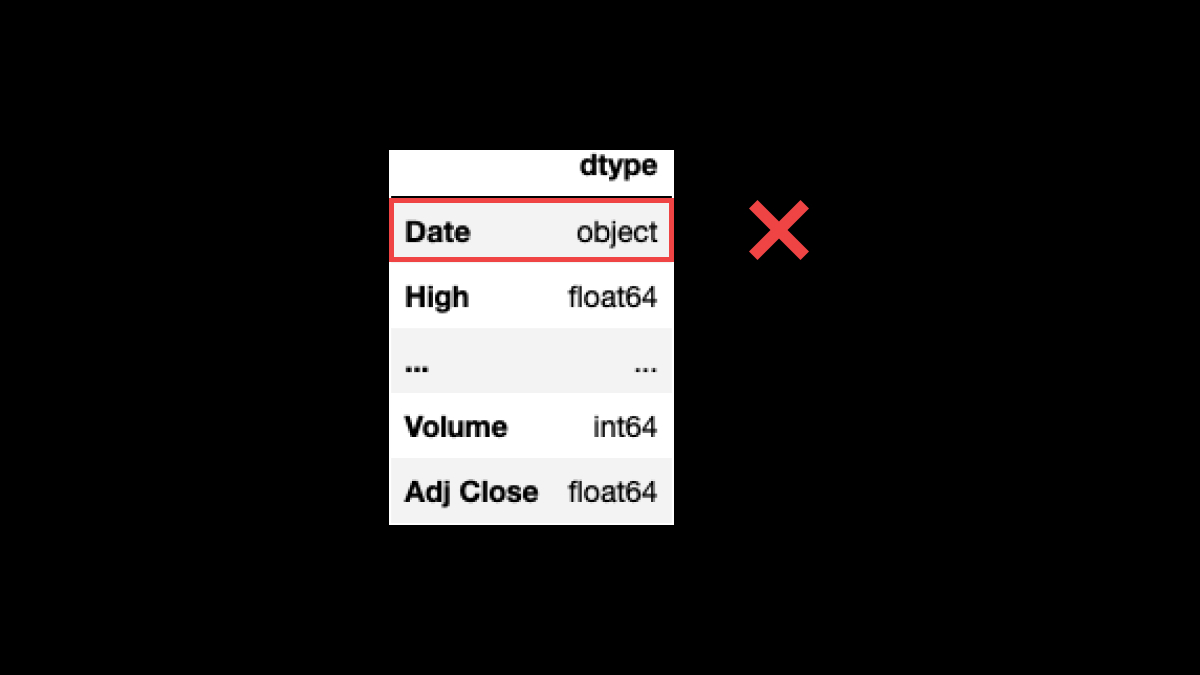
You must ensure that column Date's dtype is DateTime.
❌ It must not be an object as in the picture (often interpreted as a string).
df_tsla.dtypes.to_frame(name='dtype')
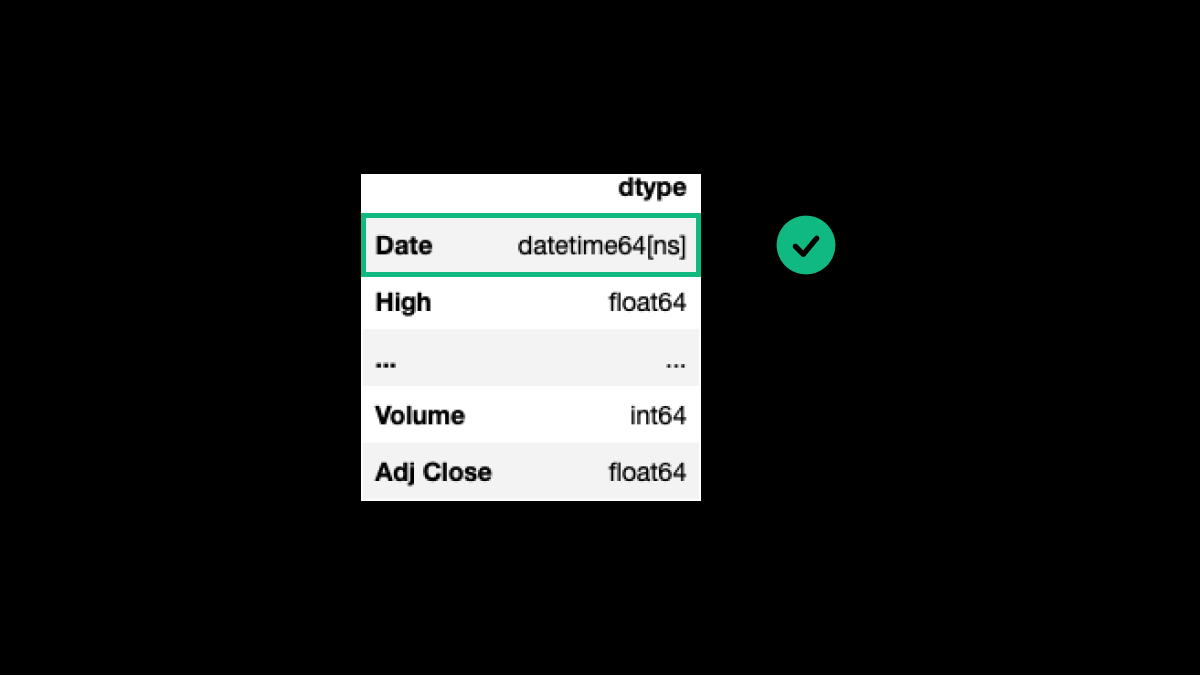
We need to convert the Date column into a datetime dtype. To do so, we can use the function pd.to_datetime():
df_tsla.Date = pd.to_datetime(df_tsla.Date)
df_tsla.dtypes.to_frame(name='dtype')
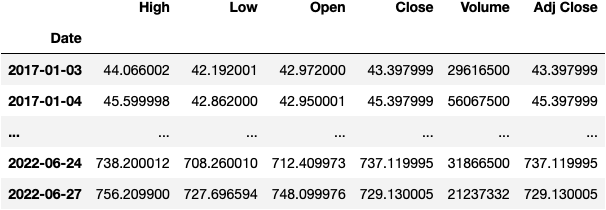
Before getting into the resample() function, we need to set the column Date as the index of the DataFrame:
df_tsla.set_index('Date', inplace=True)
df_tsla
Now let the magic happen; we'll get the maximum value of each column by each year with this simple line of code:
df_tsla.resample(rule='Y').max()
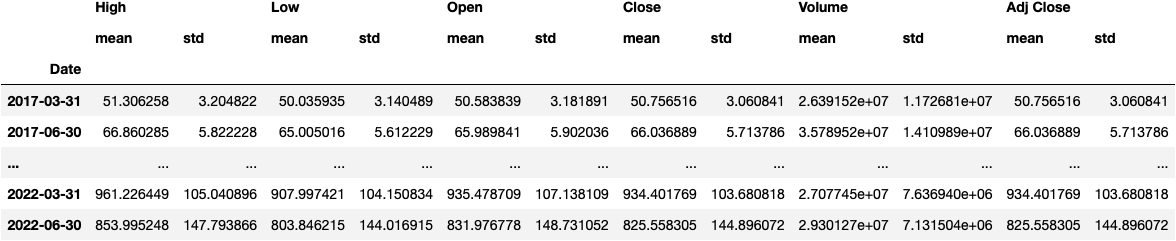
We can do many other things:
df_tsla.resample(rule='Q').agg(['mean', 'std'])
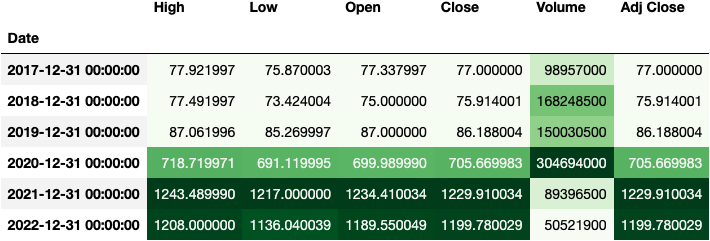
To finish it, I always like to add a background_gradient() to the DataFrame:
df_tsla.resample(rule='Y').max().style.background_gradient('Greens')
If you enjoyed this, I'd appreciate it if you could support my work by spreading the word 😊