Your First Lines of Code in Python
I am going to describe to you a method that I use with my clients when I teach Python & Data Science ↓

I coach people to develop the Resolving Discipline that turns them into independent programmers.
Programming is hard, especially at the beginning.
Don't make it yourself any harder!
Start with Data Visualization.
It's easier to understand programming with visual changes than abstract coding ("make a program that prints even numbers").
Get on Jupyter, a code editor. Here is the link to [download the program](https://www.anaconda.com/products/individual.
Your first lines of code should be as follows:
import seaborn as sns

df = sns.load_dataset('tips')
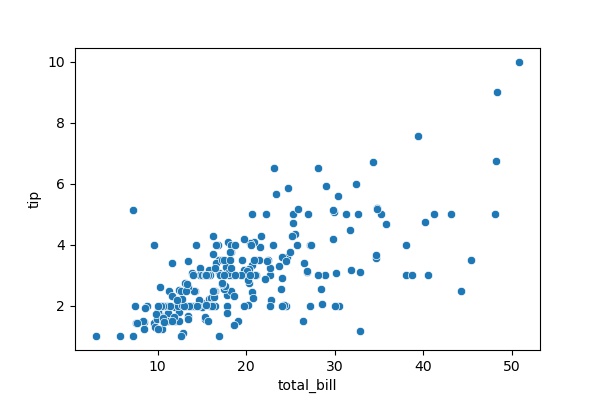
sns.scatterplot(x='total_bill', y='tip', data=df)
You would get a plot that should look like this one ↓
To configure the behaviour of the function, you should configure the code as follows:
sns.scatterplot(x='total_bill', y='tip', data=df, color='red')
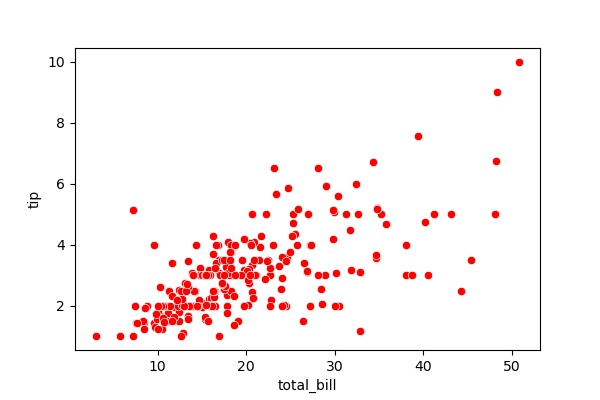
This simple change helps you to understand a couple of core concepts in programming:
Functions
sns.scatteplot()are used to make things in programming (a plot in this case).You use parameters
color='red'to configure the function's behaviour.
Feel free and welcome to ask me anything in the comments below, it will be my pleasure to help you out 🤗